Global Warming Coastal Flood Risk in California
Republish or broadcast this map: licensing & instructions. Broadcast quality versions available upon request.
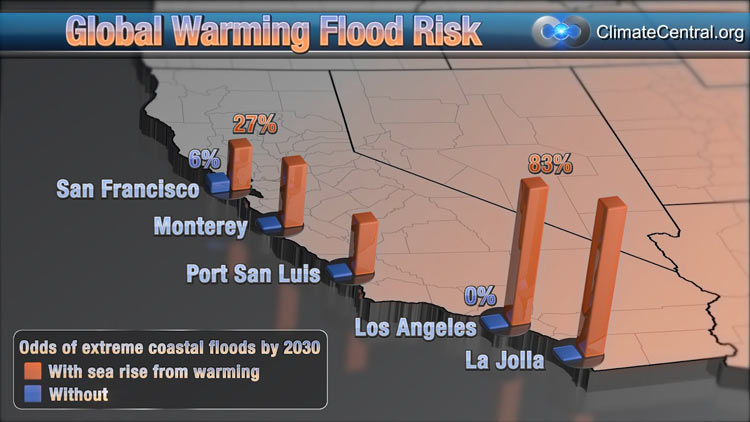
This map shows the odds of floods at least as high as historic once-a-century levels, occurring by 2030, based on Climate Central research. The two bars extending from each study point contrast odds estimates incorporating past and projected sea level rise from global warming (red bars), and odds estimates not incorporating this rise (blue bars). The century flood heights used for reference in these calculations are based on historic records, and expressed relative to sea level in 2009 to account for continually rising seas.
Global average sea level has increased more than eight inches since 1880, and the rise is accelerating. Most or all of the rise can be attributed to global warming, which warms and expands global oceans, and causes glaciers and ice sheets to decay.
<< To National Flood Risk Map
<< To All Maps
Other Flood Risk Maps by State:
California | Connecticut | Florida | Maryland | New Jersey | New York | North Carolina | Pennsylvania | South Carolina | Virginia