Maps & Tools
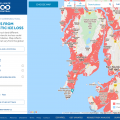
Coastal Risk Screening Tool: Ice Sheet Contributions to Sea Level Rise
The ice sheets map allows users to explore how much land different amounts of Antarctic ice loss could put below the tideline. Because ice loss causes subtle changes in the Earth’s gravitational field, rotation, and shape, local sea level increases will vary from place to place. This map reflects these differences.
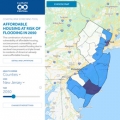
Coastal Risk Screening Tool: Affordable Housing
The affordable housing map allows users to explore what affordable housing in the U.S. could be threatened by sea level rise and coastal flooding in the coming decades, under multiple pollution scenarios. The map allows users to examine affordable housing at risk by state, city, county, congressional district, state legislative district, or zip code.
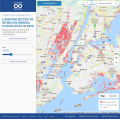
Coastal Risk Screening Tool: Map By Year
The year map allows users to explore coastal flood risk and sea level rise projections by decadal year for anywhere in the world, and under multiple pollution scenarios. The map allows users to choose between the leading sea level rise models and incorporate the most accurate elevation data available.
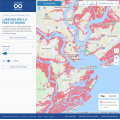
Coastal Risk Screening Tool: Map By Water Level
The water level map allows users to explore what land is at risk from specific water levels (decimal feet, meters) that could be reached through combinations of sea level rise, tides, and storm surge.
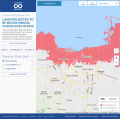
Coastal Risk Screening Tool: Map By Elevation Data
Using its new elevation data model (CoastalDEM®) Climate Central found far greater global threats from sea level rise and coastal flooding than previously thought, and greater benefits from reducing their causes. This interactive map highlights the importance of accurate elevation data for assessing coastal flood risks, but the water level and year map are better suited for actually assessing those risks.