New Slideshows - Overview
Climate Central's Surging Seas Risk Finder is a public web tool that provides local projections, maps and assessments of exposure to sea level rise and coastal flooding tabulated by zip code, municipality, and various other planning, legislative districts.
Surging Seas Risk Finder is based on peer-reviewed research methods and the best available elevation data. The elevation data and analysis in Surging Seas Risk Finder succeeds Surging Seas 1.0, and is highly consistent with NOAA's Sea Level Rise and Coastal Flooding Impacts Viewer.
Surging Seas Risk Finder includes four interactive modules that let users explore maps of at-risk areas, the timeline of local sea level and flood risk, what structures and populations could be affected, and comparisons of risk across different areas.
Note: The analyses contained on this website should not be taken as precise predictions or flood emergency guides. Rather, we present them as risk indicators in a world of rising sea levels and increasing floods.
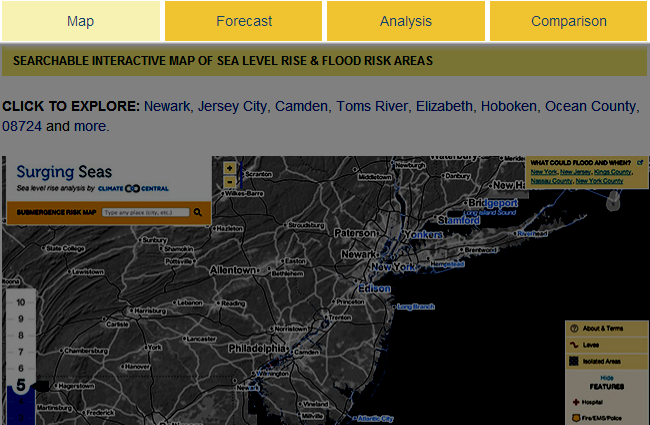
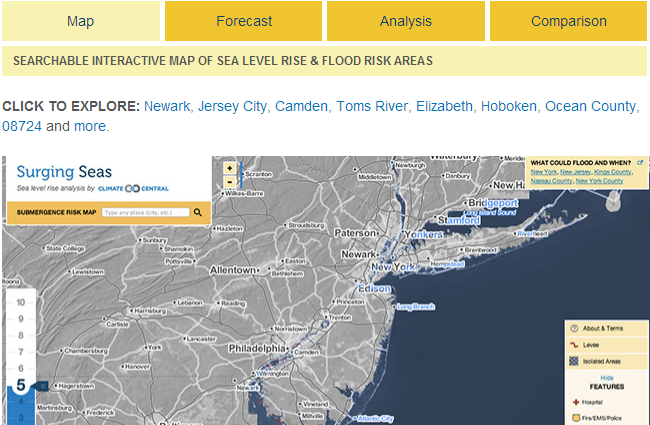
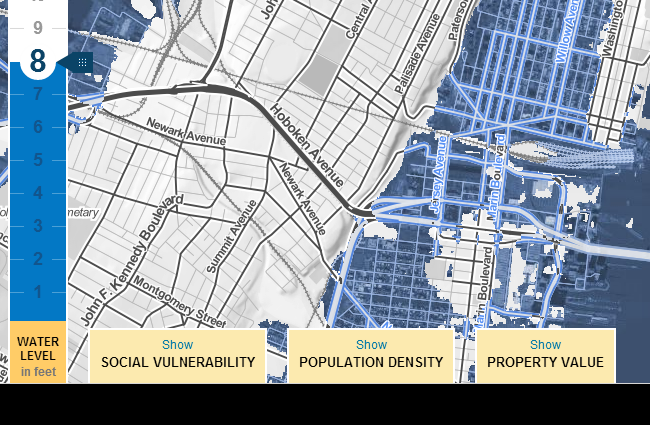
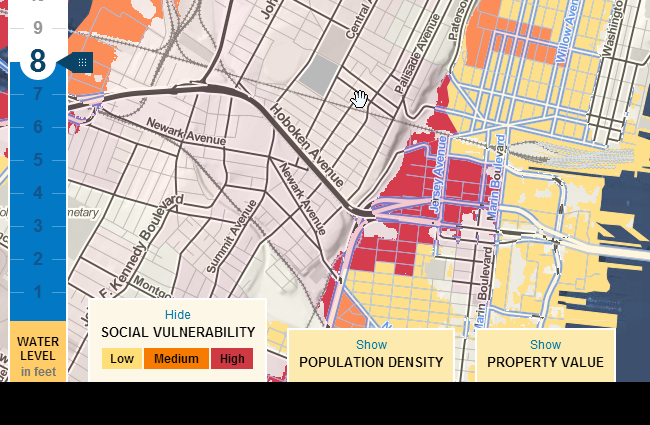
The Submergence Risk Map shows areas vulnerable to flooding from combined sea level rise, storm surge, and tides, or to permanent submersion by long-term sea level rise. It provides the capability to explore and investigate entire coastal states at different magnifications.
Surging Seas utilizes lidar supplied by NOAA and uses as its inundation model a modified bathtub approach, modeling hydrologic connectivity and locally adjusted Mean Higher High Water levels
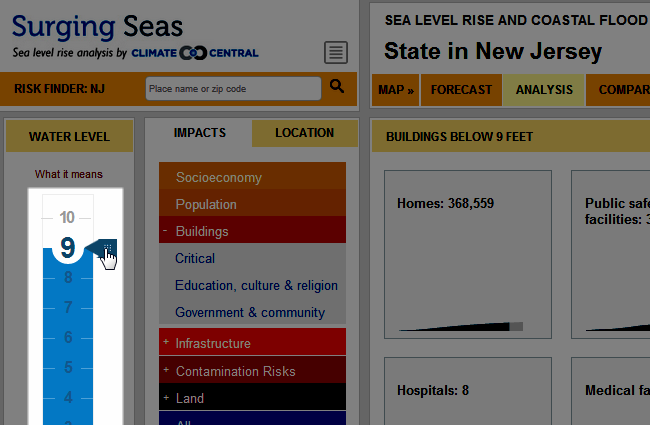
As the user adjusts the water level from 1 to 10 feet, the map changes dynamically.
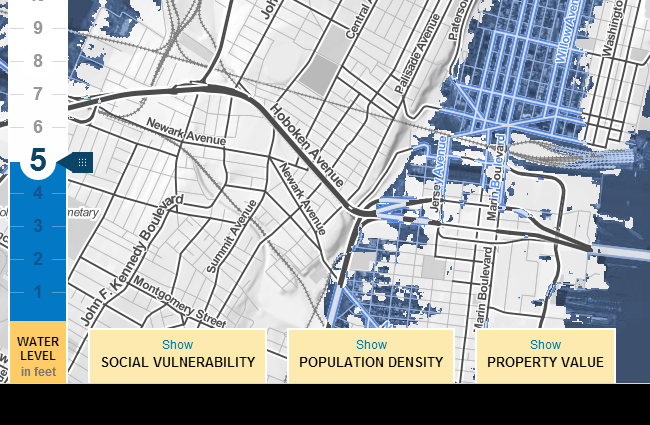
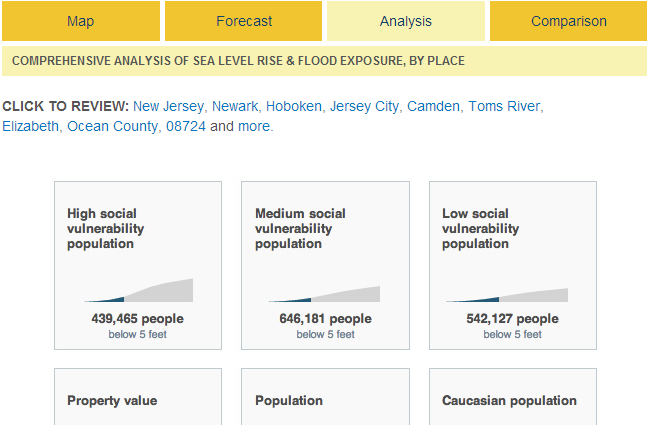
The map provides social vulnerability, population density and property value layers.
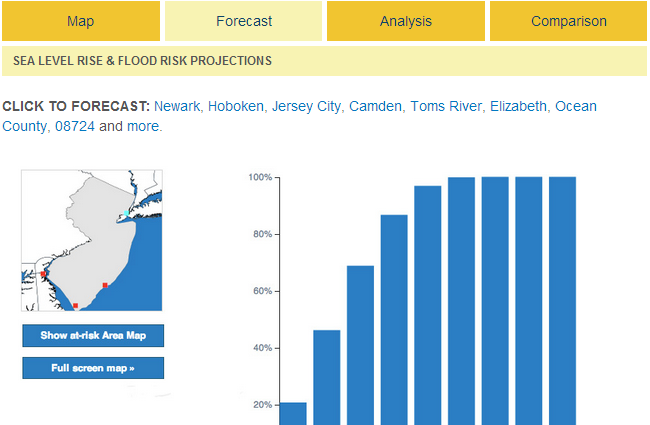
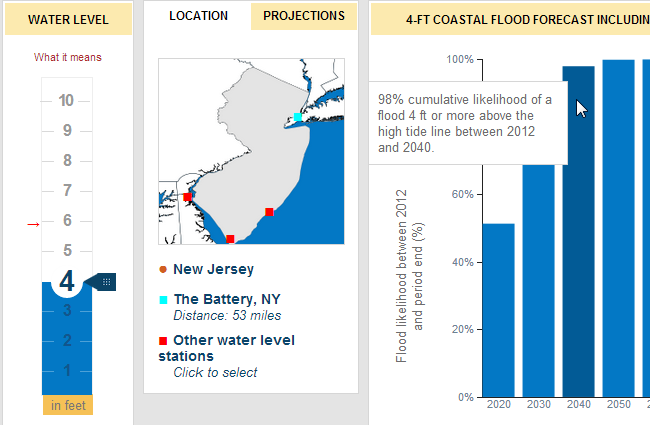
Surging Seas Risk Finder presents localized projections for sea level rise and coastal flood risk in great detail, and according to a range of different models and assumptions that the user can set.
Projections are based on (1) Climate Central's historical analysis of flood data from the nearest NOAA water station and (2) the user-selected SLR model / emissions scenario
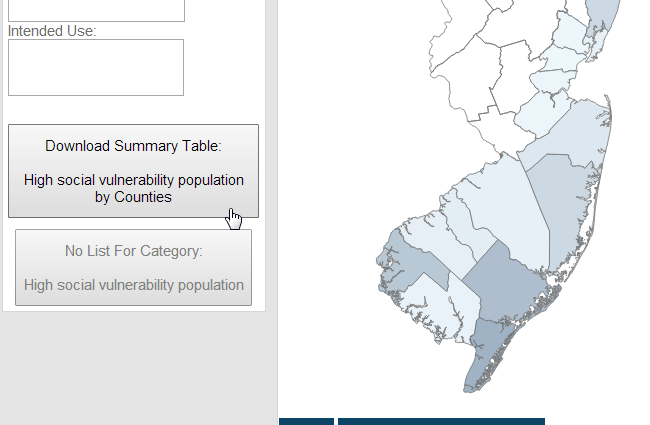
The analysis section of Risk Finder includes exposure assessments of more than 100 demographic, economic, infrastructure and environmental variables using data drawn mainly from federal sources, including NOAA, USGS, FEMA, DOT, DOE, DOI, EPA, FCC and the Census.
Adjust the slider and the data tiles will change dynamically, as percentages or totals.
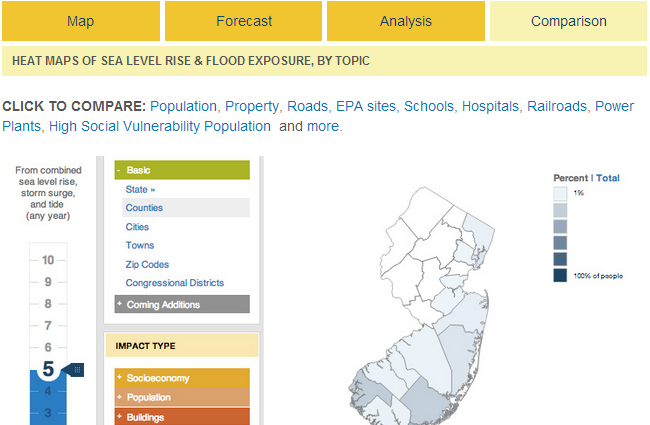
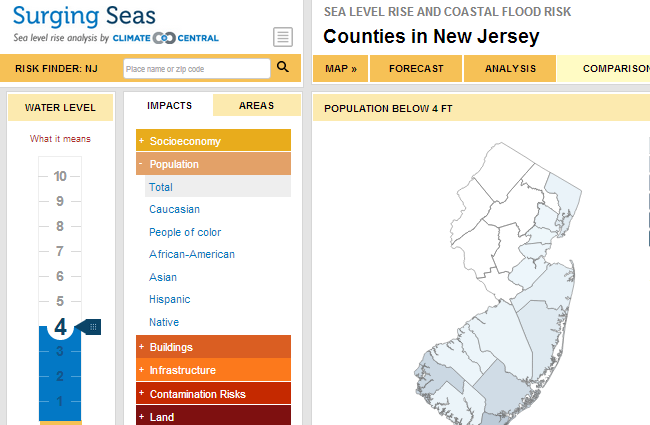
The comparison section, view heat maps of sea level rise & flood exposure, by topic.
Surging Seas Risk Finder allows users to compare threats across the entire state. As the user adjusts the water level from 1 to 10 feet, results adjust instantly.
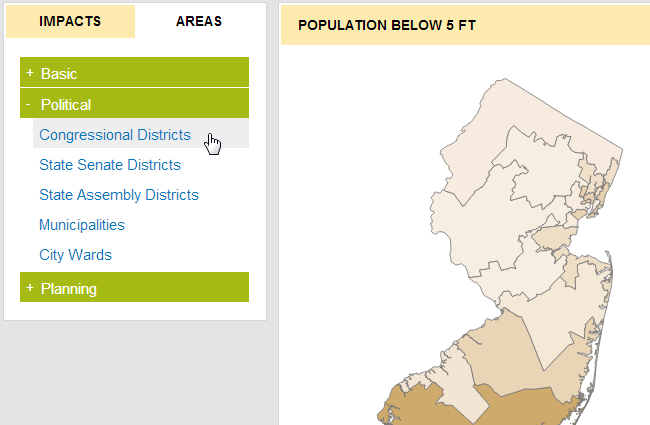
Analysis is grouped by area type. Click the "Areas" tab to select a boundary type that will divide up the state.
Download excel sheets of data details at the state-wide level or local level.
Learn more about the Surging Seas Risk Finder by viewing the other more detailed slide sets available on the help page.