New Slideshows - Where
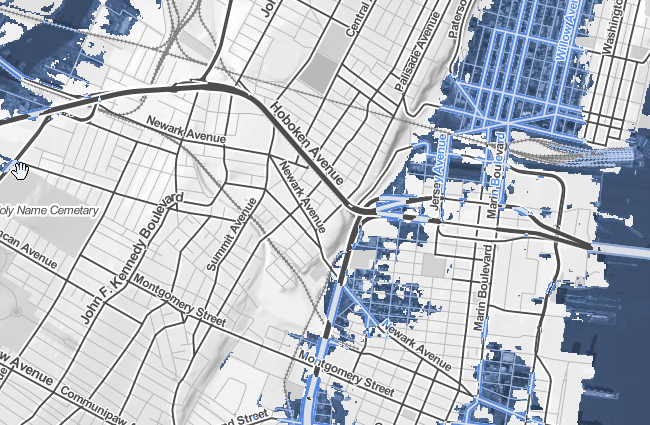
View a searchable interactive map of sea level rise & flood risk areas.
Surging Seas utilizes lidar supplied by NOAA and uses as its inundation model a modified bathtub approach, modeling hydrologic connectivity and locally adjusted Mean Higher High Water levels
Water level means feet above the local high tide line (MHHW), any year, through combinations of sea level rise, tide and storm surge. Sea level has been rising, and scientists agree the rise will accelerate, growing its effect on floods.
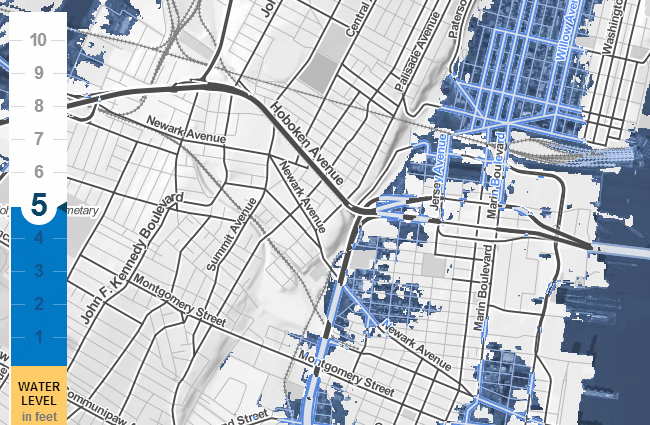
The water level is set to 5 feet in the example above.
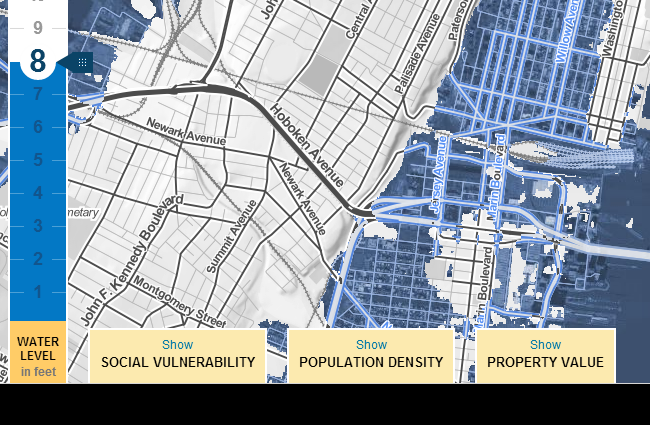
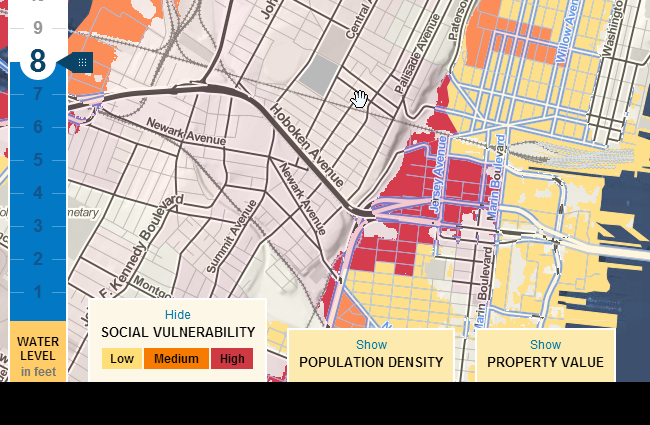
Adjust the water level to view land area below a given elevation.
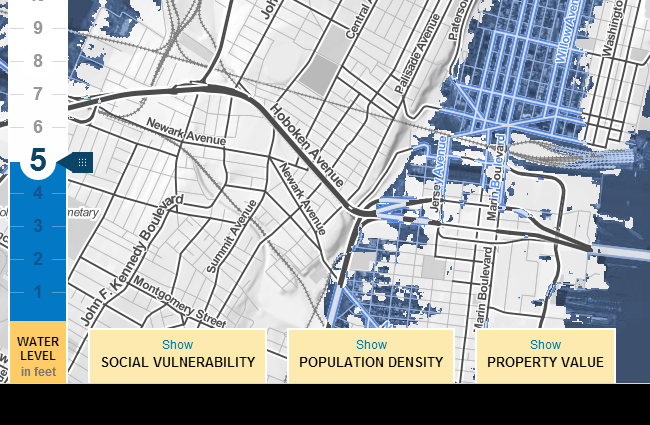
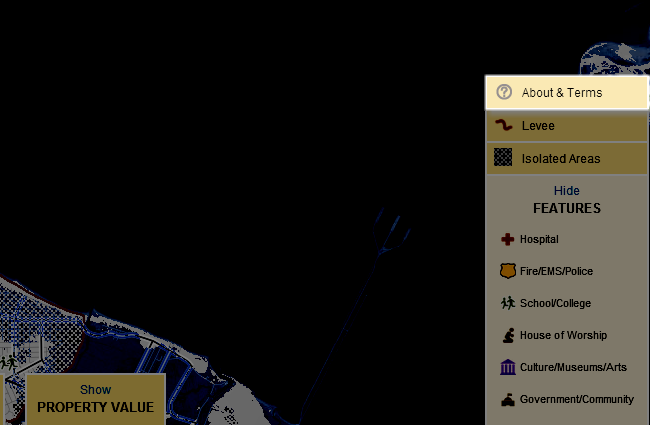
Click the "Social Vulnerability" tab to view that data layer.
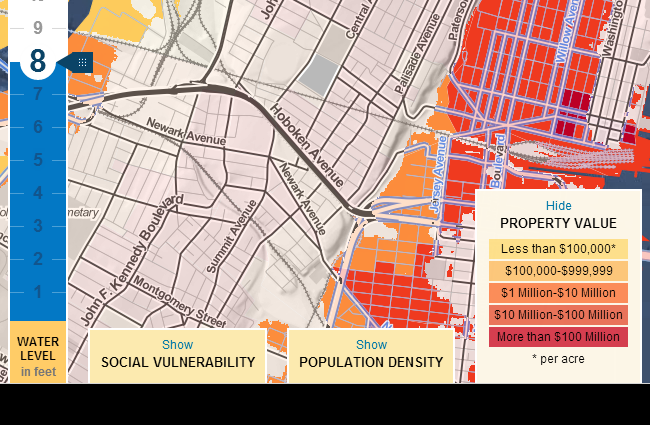
Click the "Property Value" tab to view that data layer.
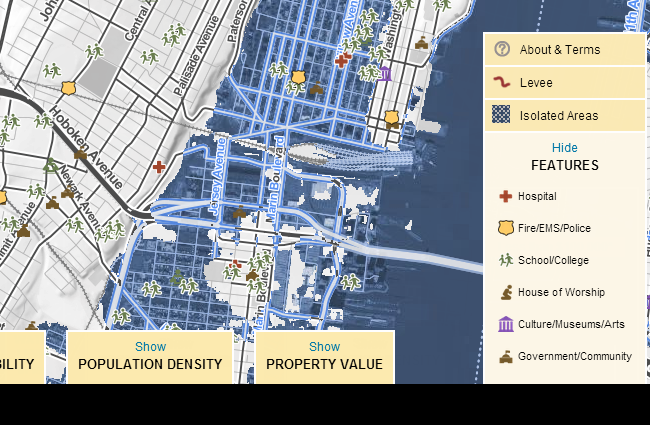
Click the "Show FEATURES" tab to view points of interest.
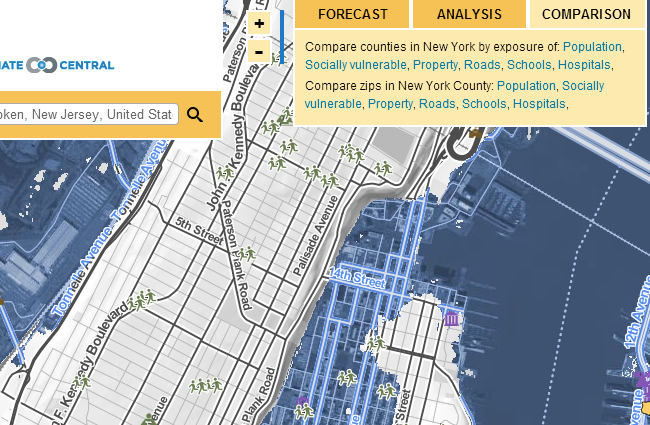
Click "COMPARISON" and click a blue link to compare counties or zip codes.
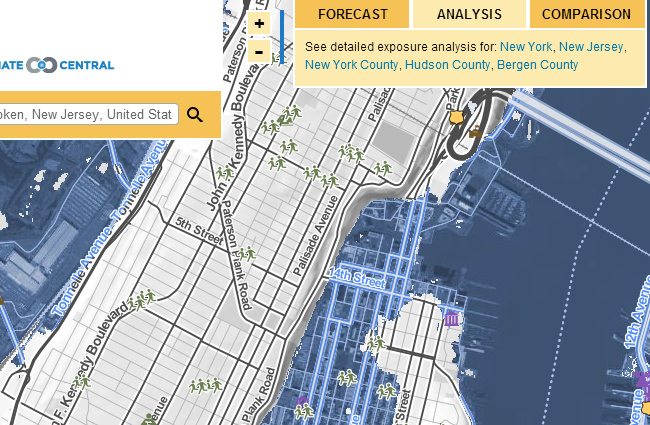
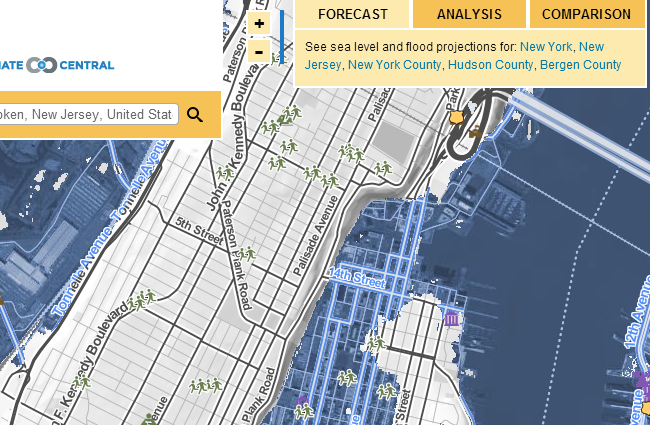
Click "ANALYSIS" and click a blue location link to see exposure analysis involving 100+ data variables.
Click "FORECAST" and click a blue location link for localized sea level and flood projections.
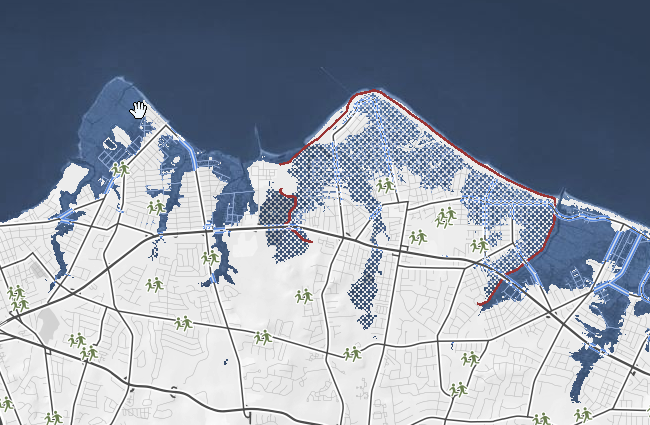
Levees are displayed as red lines. Isolated areas are displayed in a blue hatch pattern. Isolated land is land that is disconnected from the ocean by ridges or levees.
Click About & Terms to view methods, terminology, terms of use and other technical information.
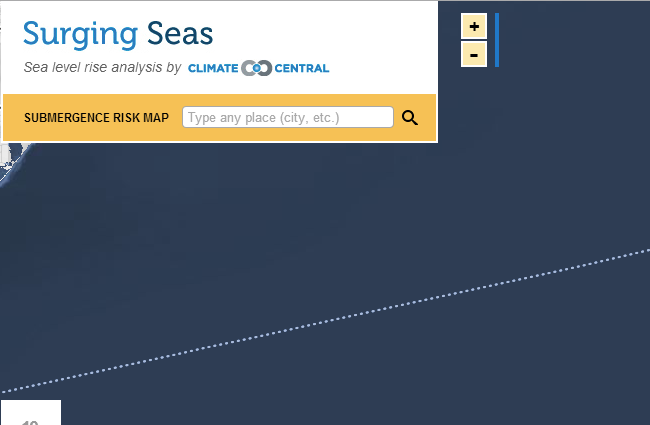
Search for the name of a place, city or zip code in the search box.