New Slideshows - When
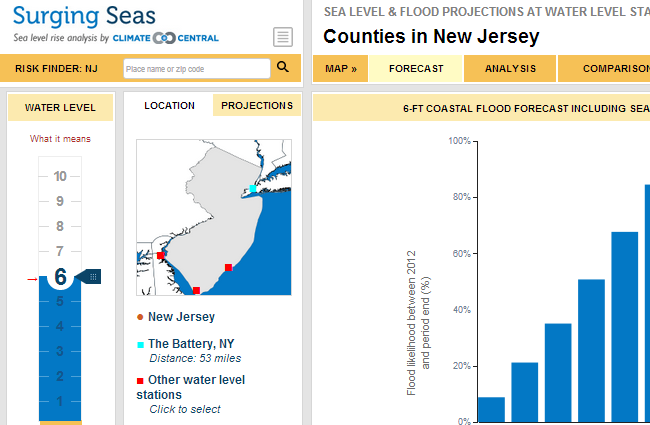
In the Forecast section, view sea level rise & flood risk projections.
Note: The analyses contained on this website should not be taken as precise predictions or flood emergency guides. Rather, we present them as risk indicators in a world of rising sea levels and increasing floods.
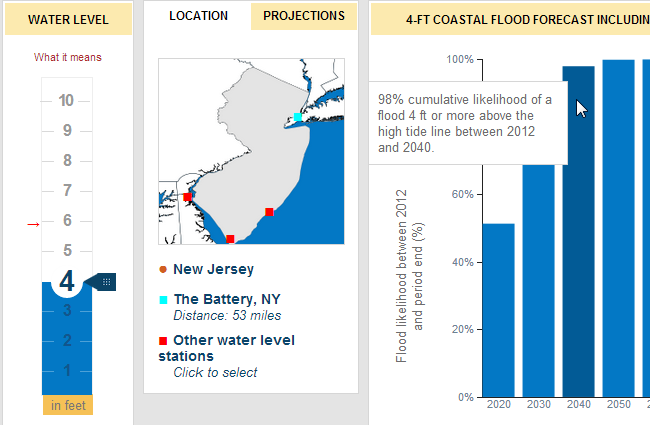
Hover your mouse over any decadal blue bar to view details about SLR & flood risk.
Projections are based on (1) Climate Central's historical analysis of flood data from the nearest NOAA water station and (2) the selected SLR model
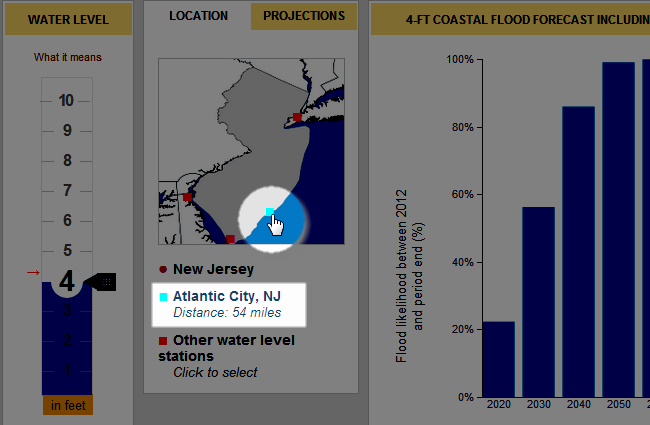
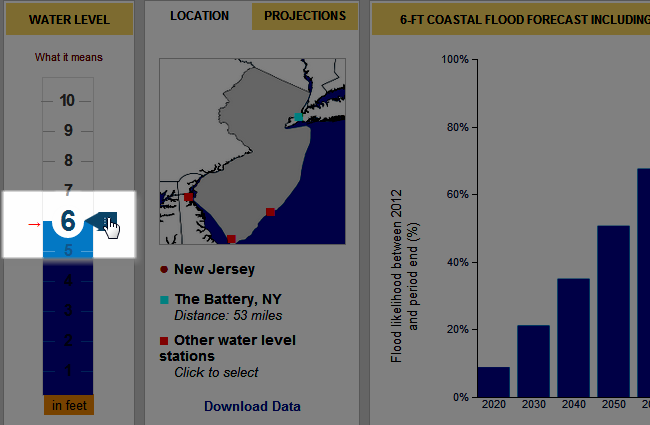
Change the water level station used in the analysis by clicking the red squares on the map, which represent NOAA stations. The red square will turn blue. Distance to location being analyzed is displayed.
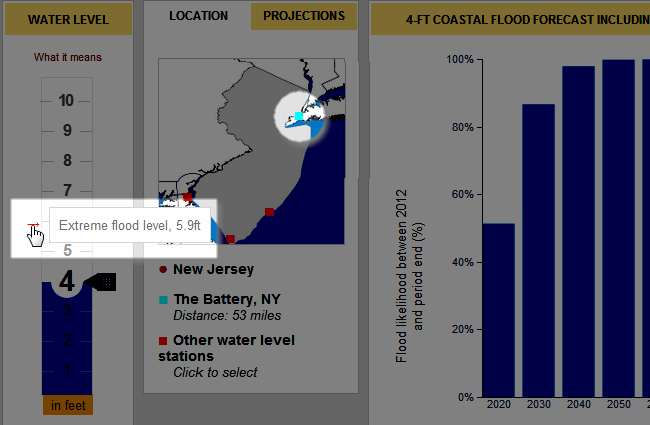
The red arrow on the water level slider indicates the extreme flood height level for any particular NOAA water level station chosen.
Adjust the water slider to another flood height and information contained in the bar chart will change dynamically.
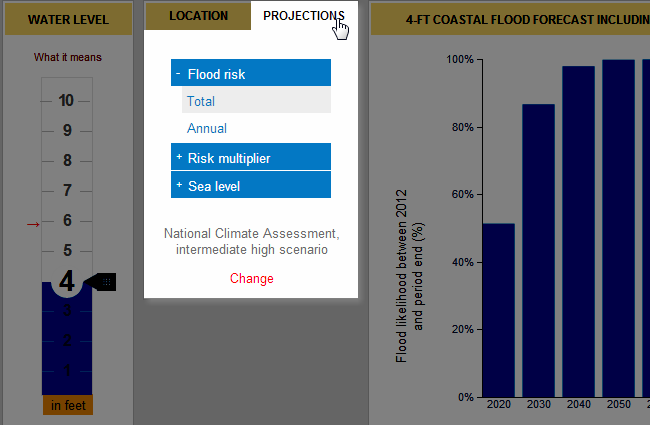
To change the projection type, click the "Projections" tab.
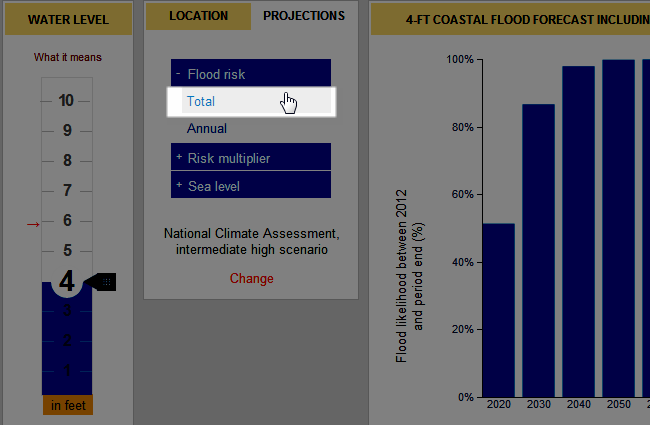
Click "Total" to view the Total/Cumulative flood risk which is risk of at least one flood exceeding a certain height BY a given year (that is, risk of a flood at any point from the present and through the future year).
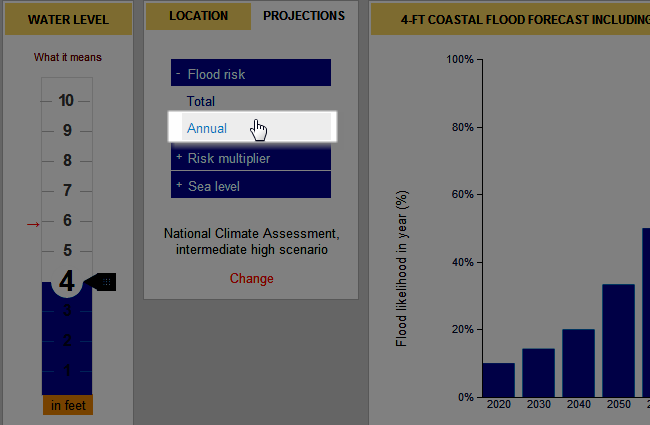
Click "Annual" to view annual flood risk, which is the risk of at least flood exceeding a certain height WITHIN a given year.
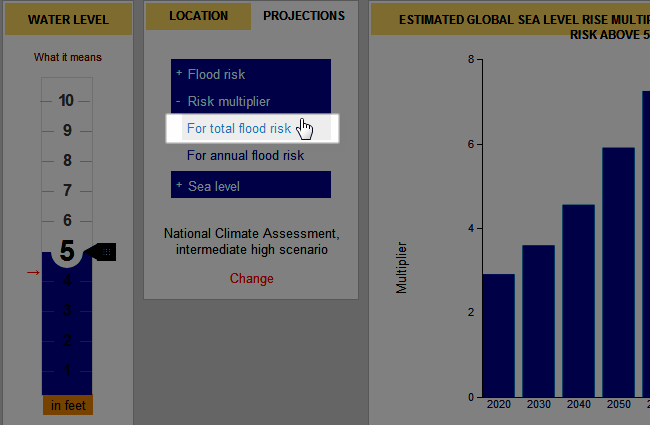
Under "Risk multiplier", click "risk multiplier for a total flood risk" to see how much projected total global SLR (from global warming) through a certain year multiplies total flood risk.
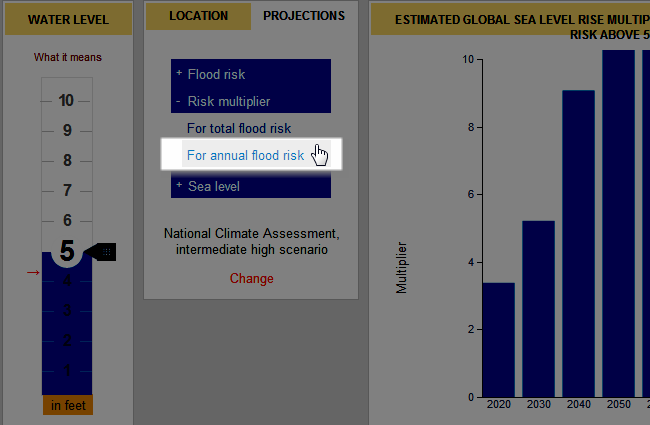
Under "Risk multiplier", click "risk multiplier for annual flood risk" to see how much projected total global SLR (from global warming) through a certain year multiplies the annual flood risk.
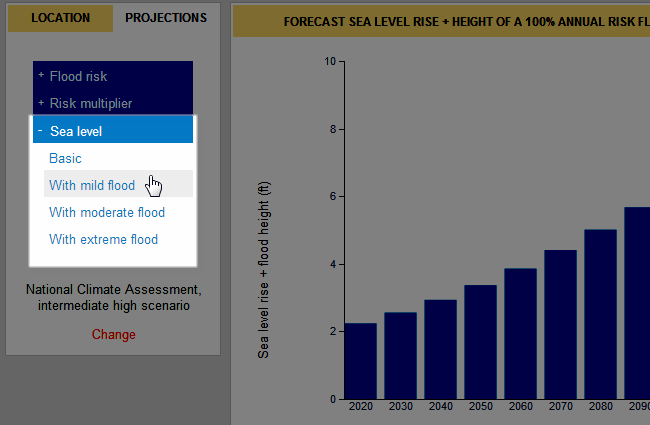
View different sea level rise projections under the Sea level menu. Hover your mouse over any blue bar for specific numbers.
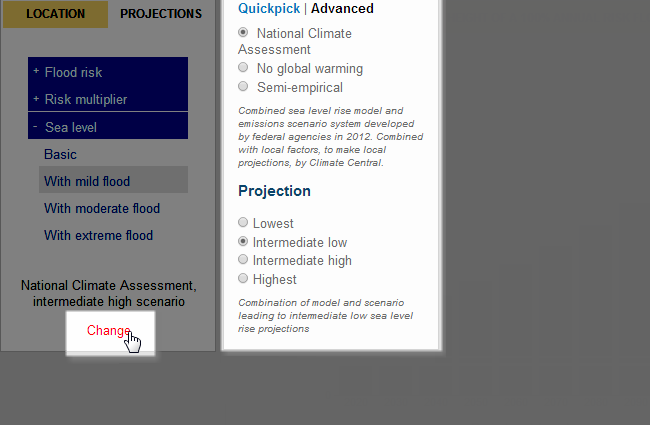
Click "Change" to change the SLR model / emissions scenarios. The blue bars in the graph will change dynamically.