New Slideshows - What
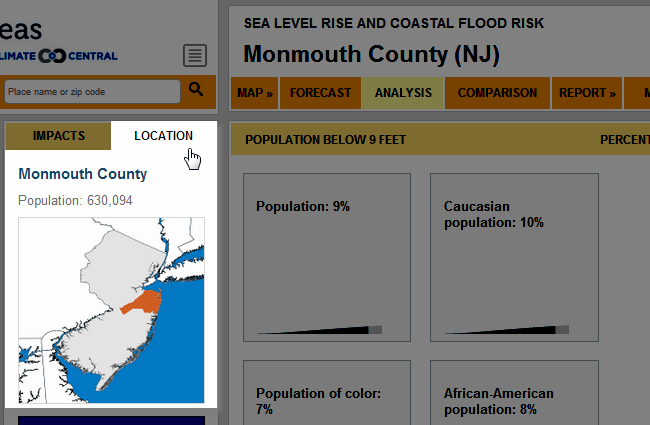
In the Analysis section, explore comprehensive analysis of sea level rise & flood exposure, by place.
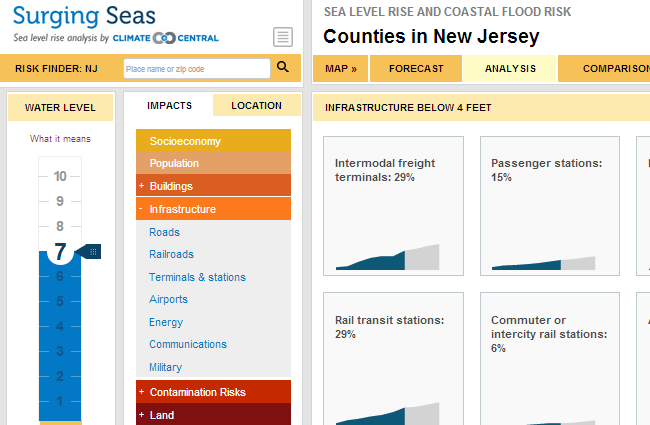
In the Analysis section, view data analysis tiles by category to quickly scan what is at risk by viewing the 100+ data tiles grouped by category.
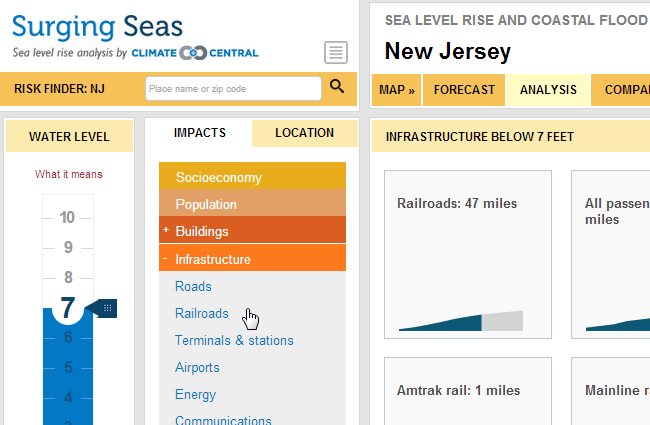
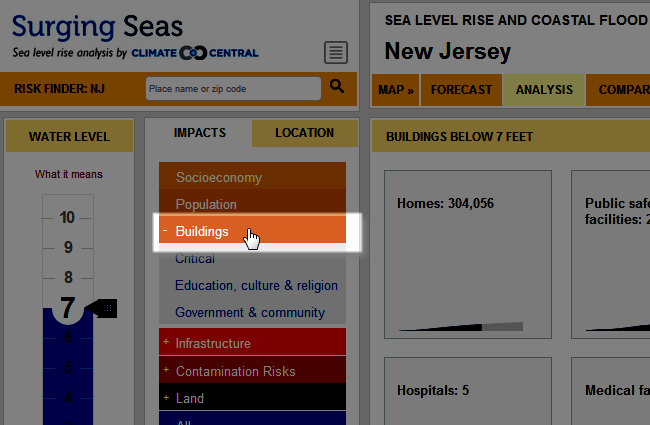
Click the categories on the left menu to change and filter which data tiles displayed. You can filter by sub-category as well.
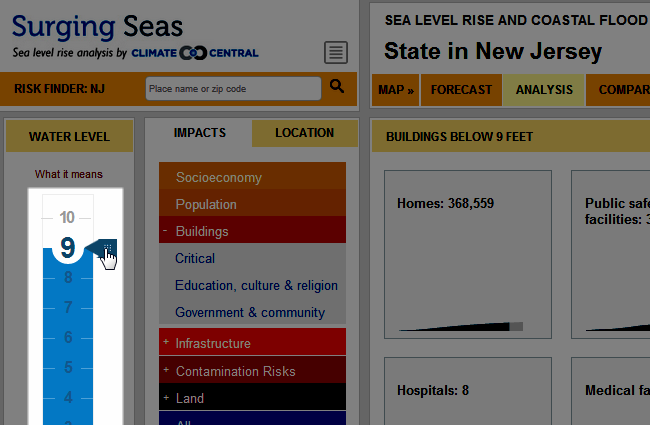
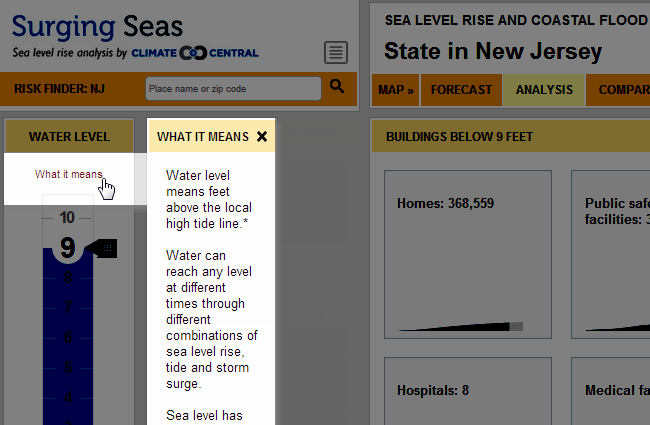
Adjust the water level slider and the information in the data tiles changes dynamically.
Click "What it means" to learn what the water level means in the Risk Finder.
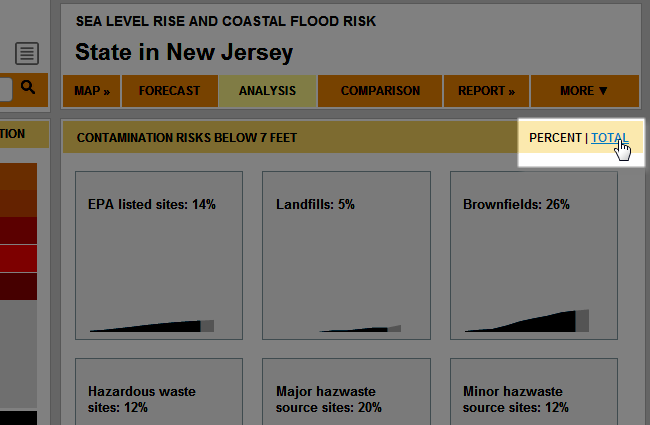
Click PERCENT or TOTAL in the top right to toggle data view.
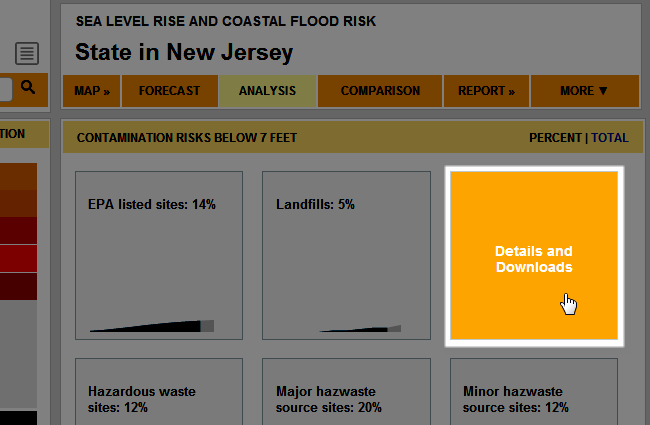
Click any tile to view data details and download information.
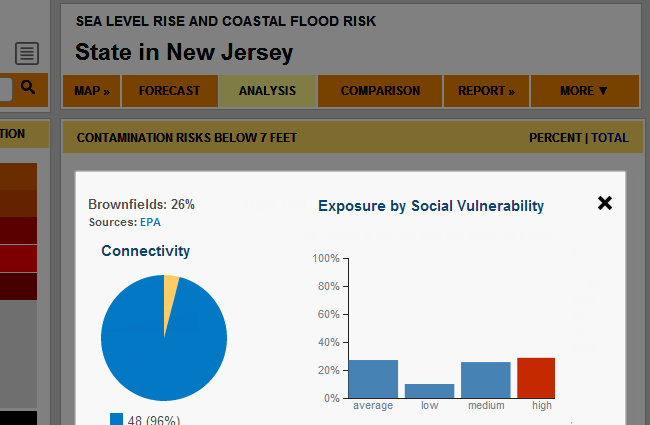
The data details page displays methods, sources, connectivity, and social vulnerability information.
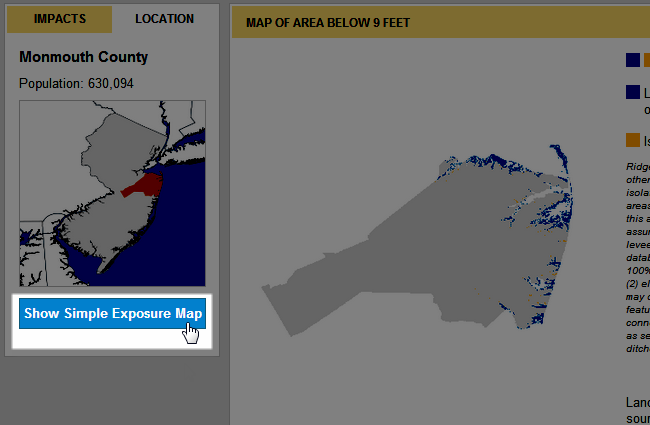
Click the Location tab to view which location is being analyzed.
Click Show Simple Exposure Map to view an exposure map. Adjust water slider to see image change dynamically.